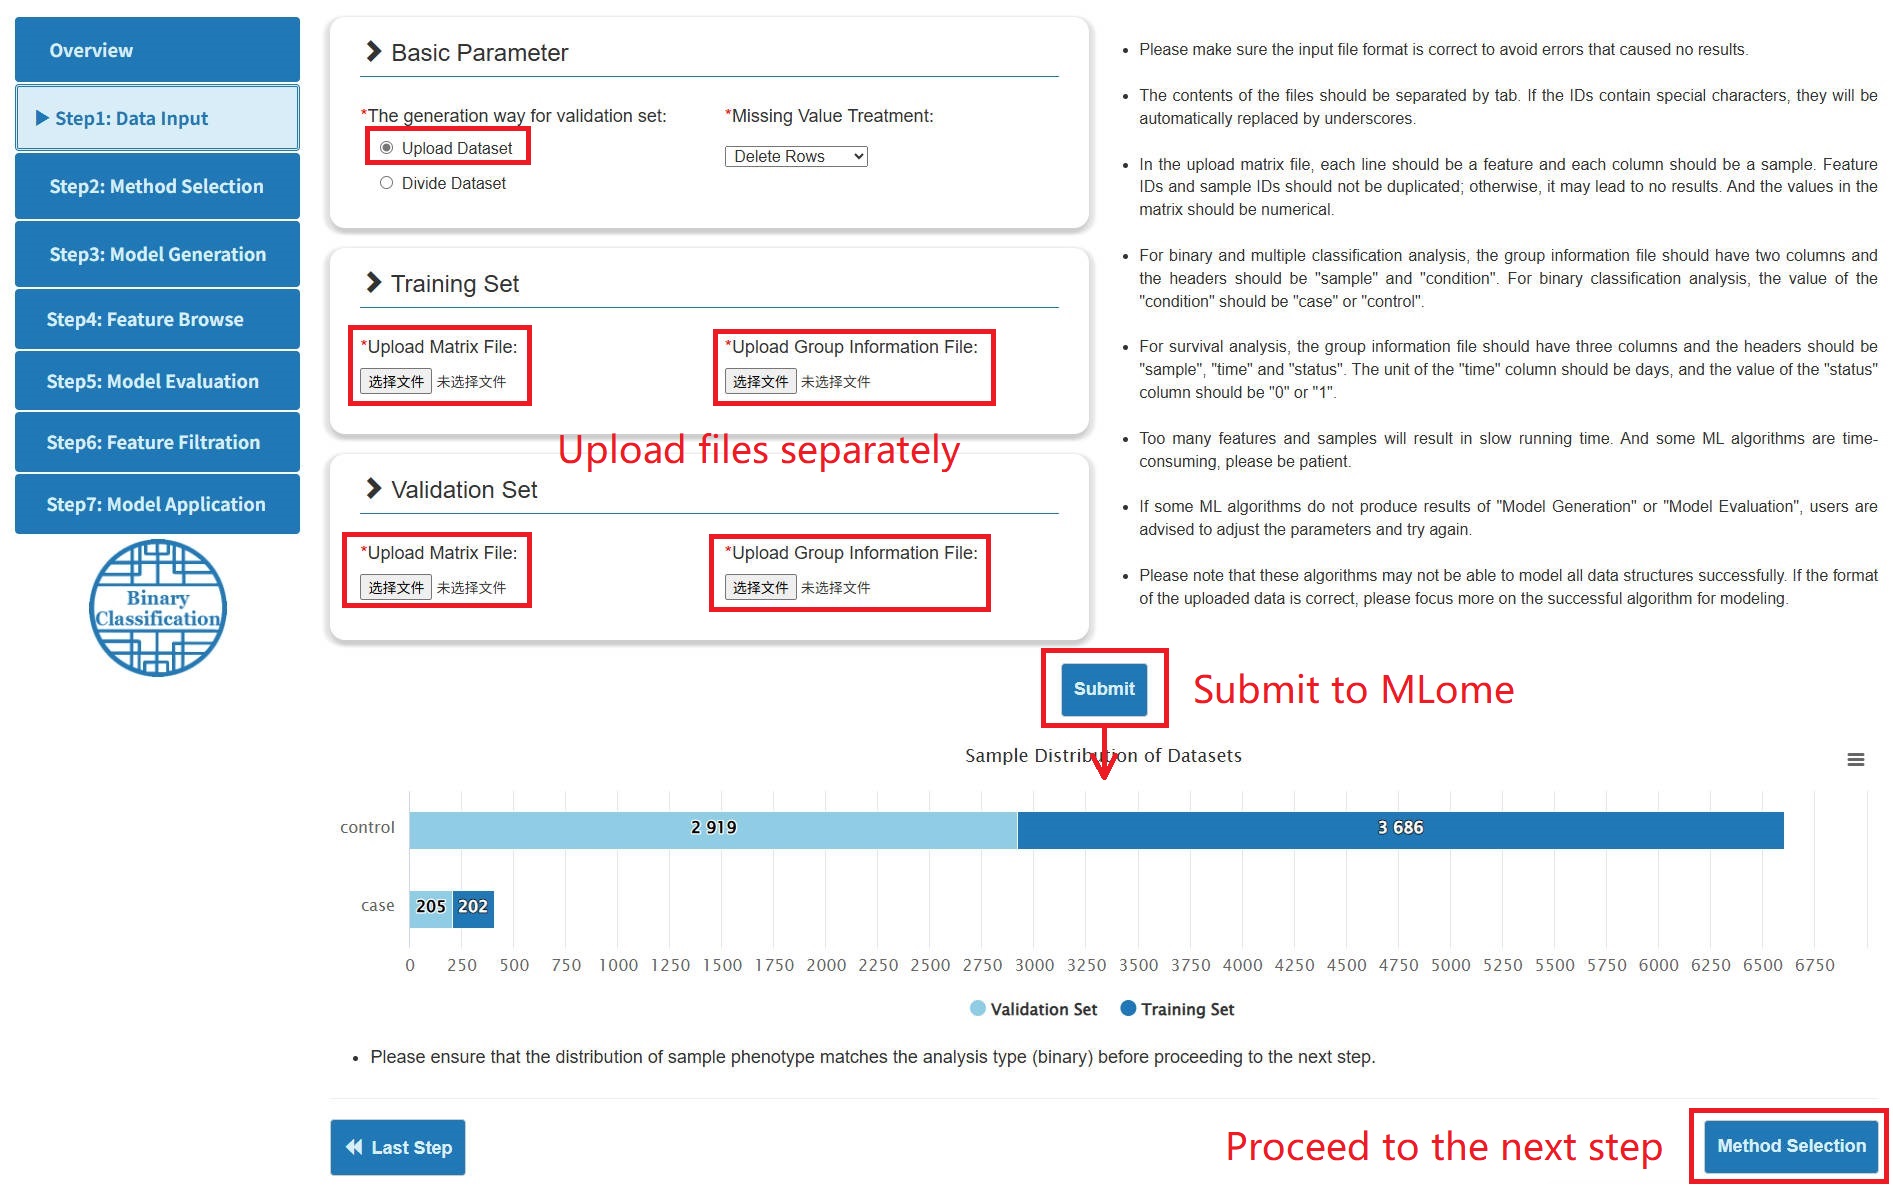
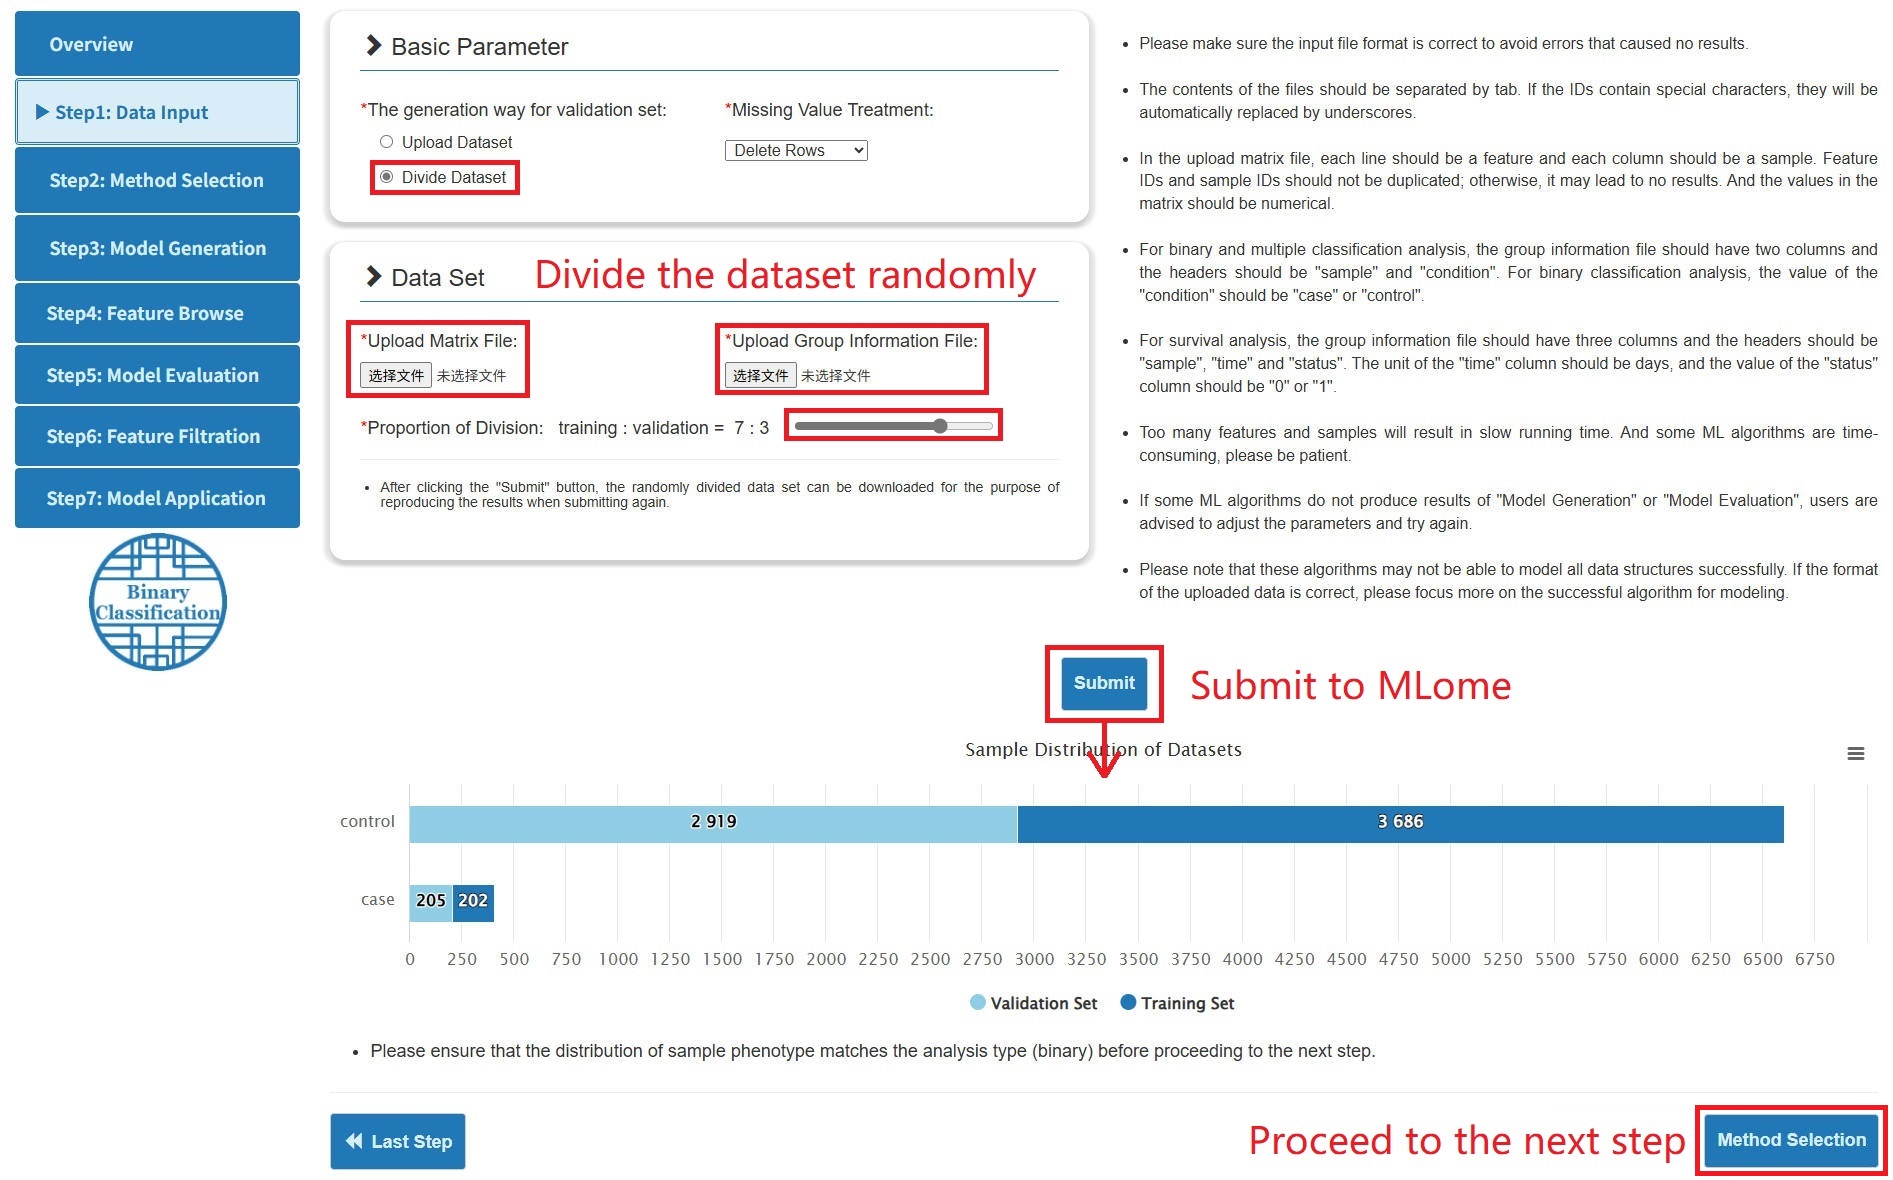
Step 1: Data Input
- The implementation of binary / multiple classification and survival analysis requires a training set and validation set including matrix files and phenotypic files, totaling 4 files.
- According to the generation way for validation set, there are two ways to upload files: (1) Upload the training set and the validation set separately. (2) Upload a comprehensive dataset and then randomly divide it into a training set and a validation set according to the scale.
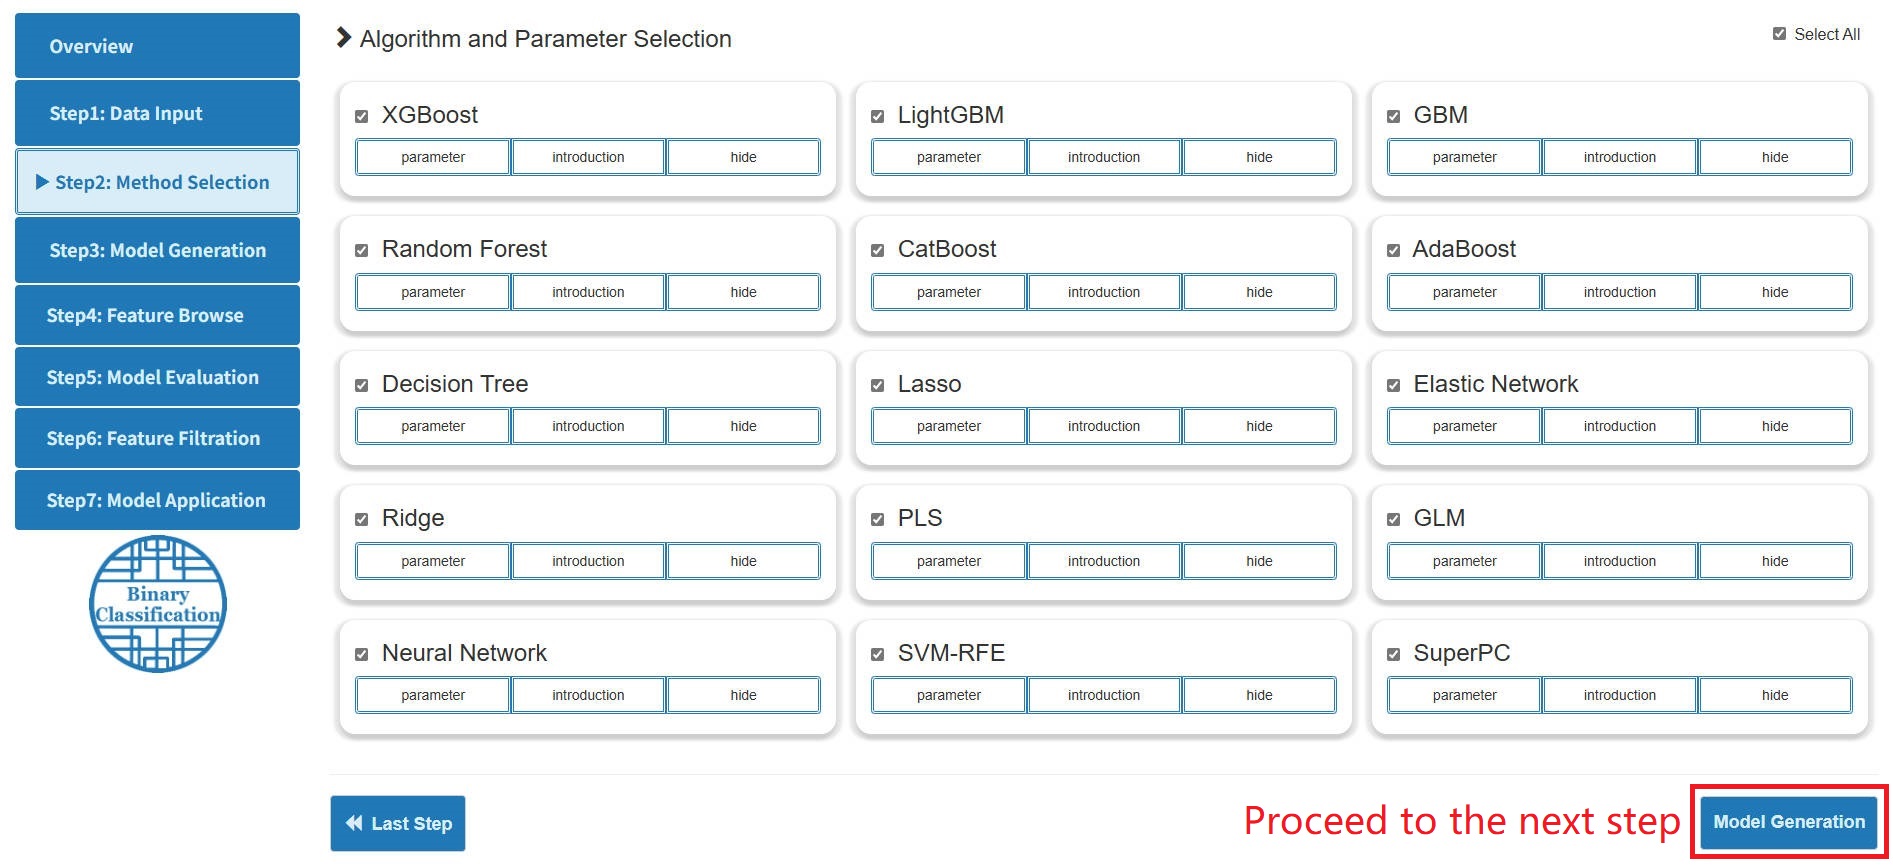
Step 2: Method Selection
- Users can choose the machine learning algorithms of interest for analysis.
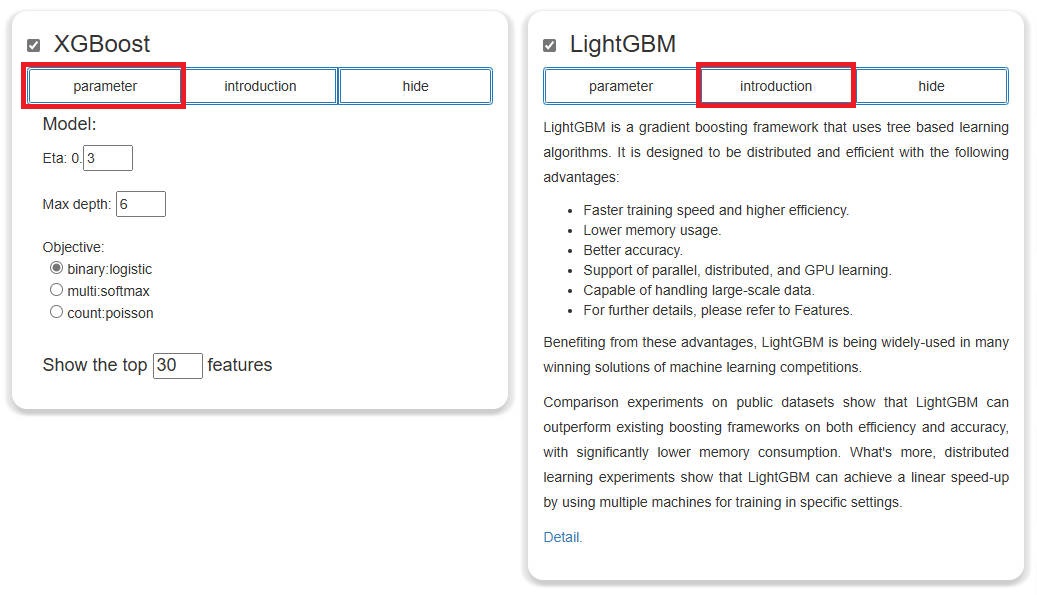
- Click the "parameter" button to display the optional parameters to adjust. Click the "introduction" button to show a simple description of the algorithm.
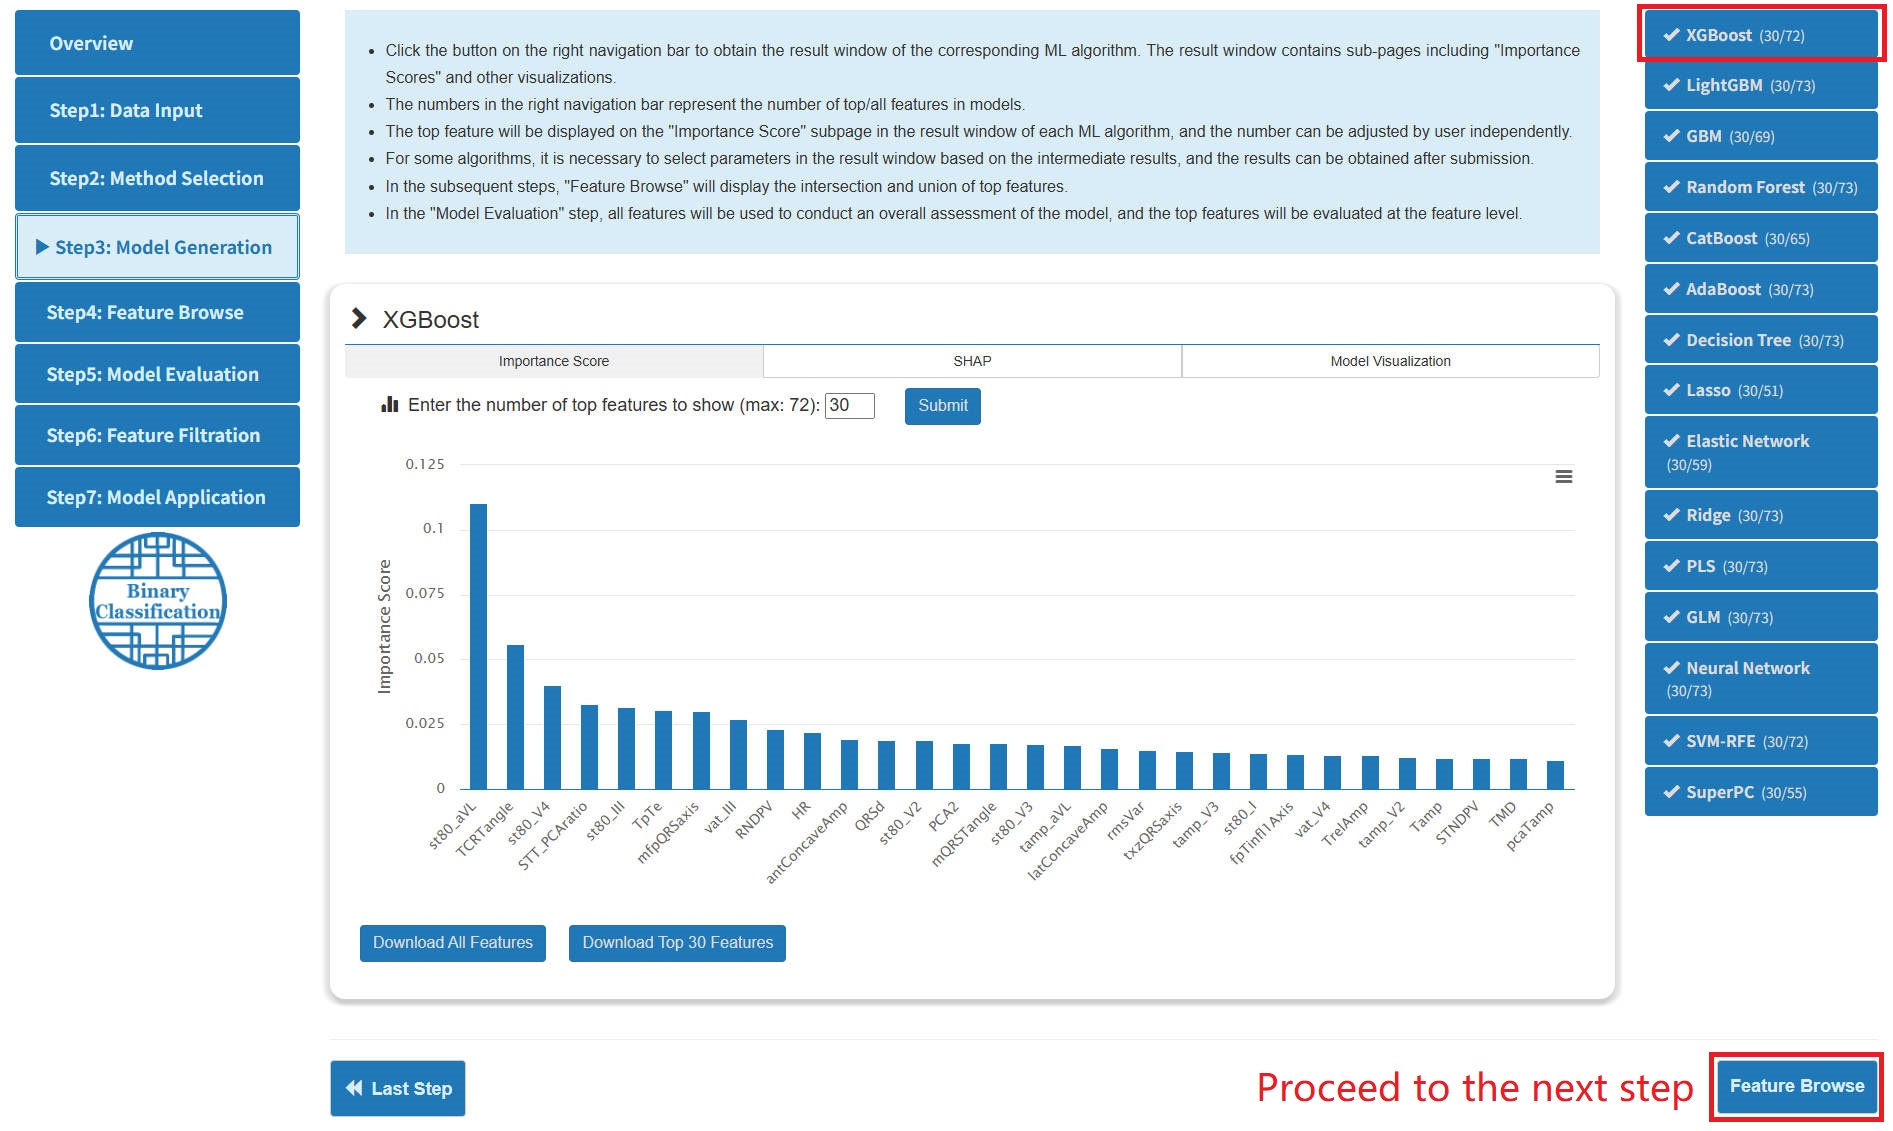
Step 3: Model Generation
- After the generation of models, clicking on the navigation bar on the right will display the result window of the corresponding algorithm. The content in the window contains 3 sub-pages: "Importance Score", "SHAP" and "Model Visualization".
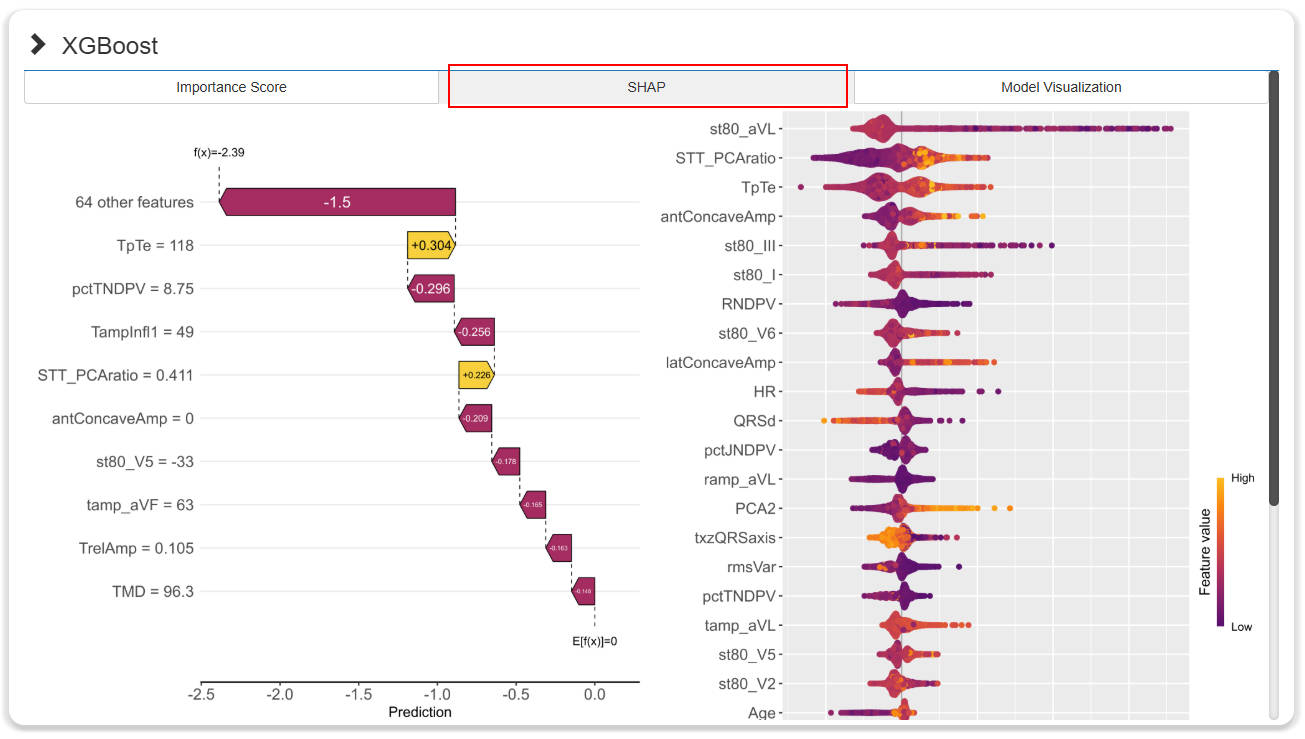
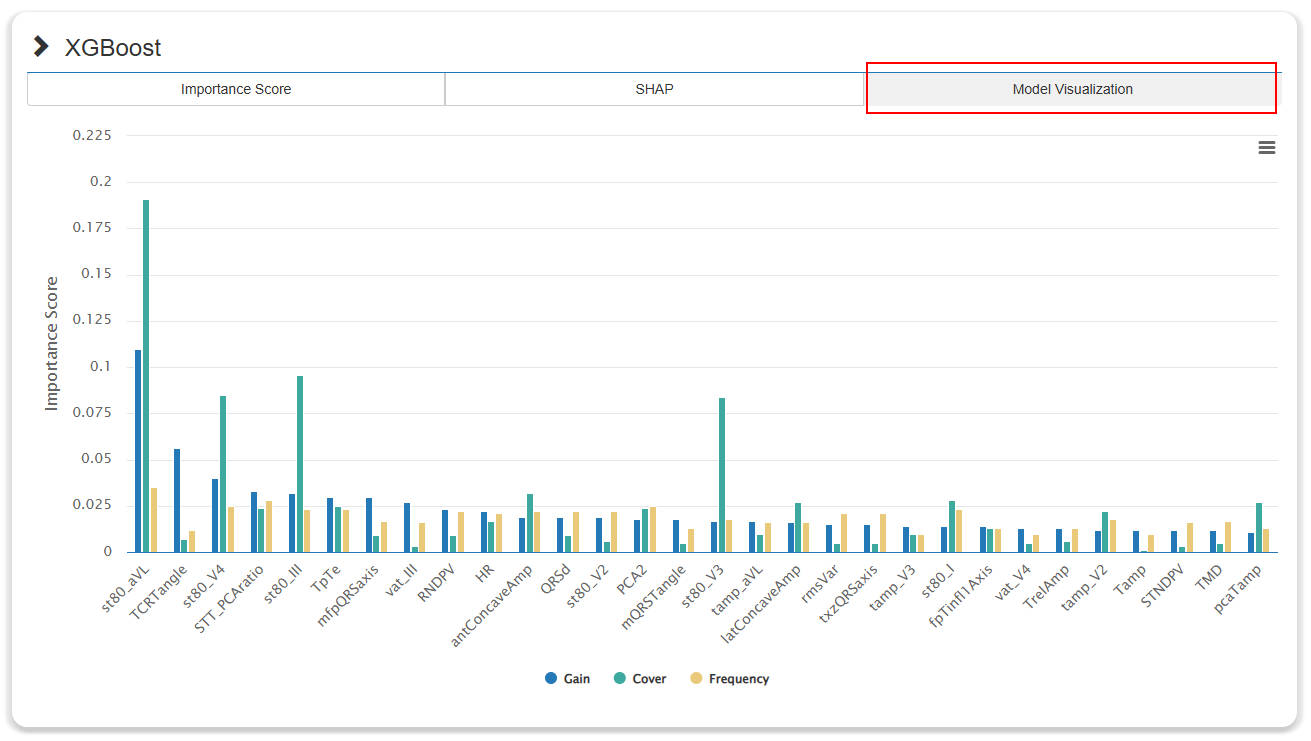
- The "Importance Score" subpage shows the importance score of the top features. Users can independently set thresholds to control the number of top features for subsequent steps. And the "SHAP" and "Model Visualization" subpages explain and visualize the model.
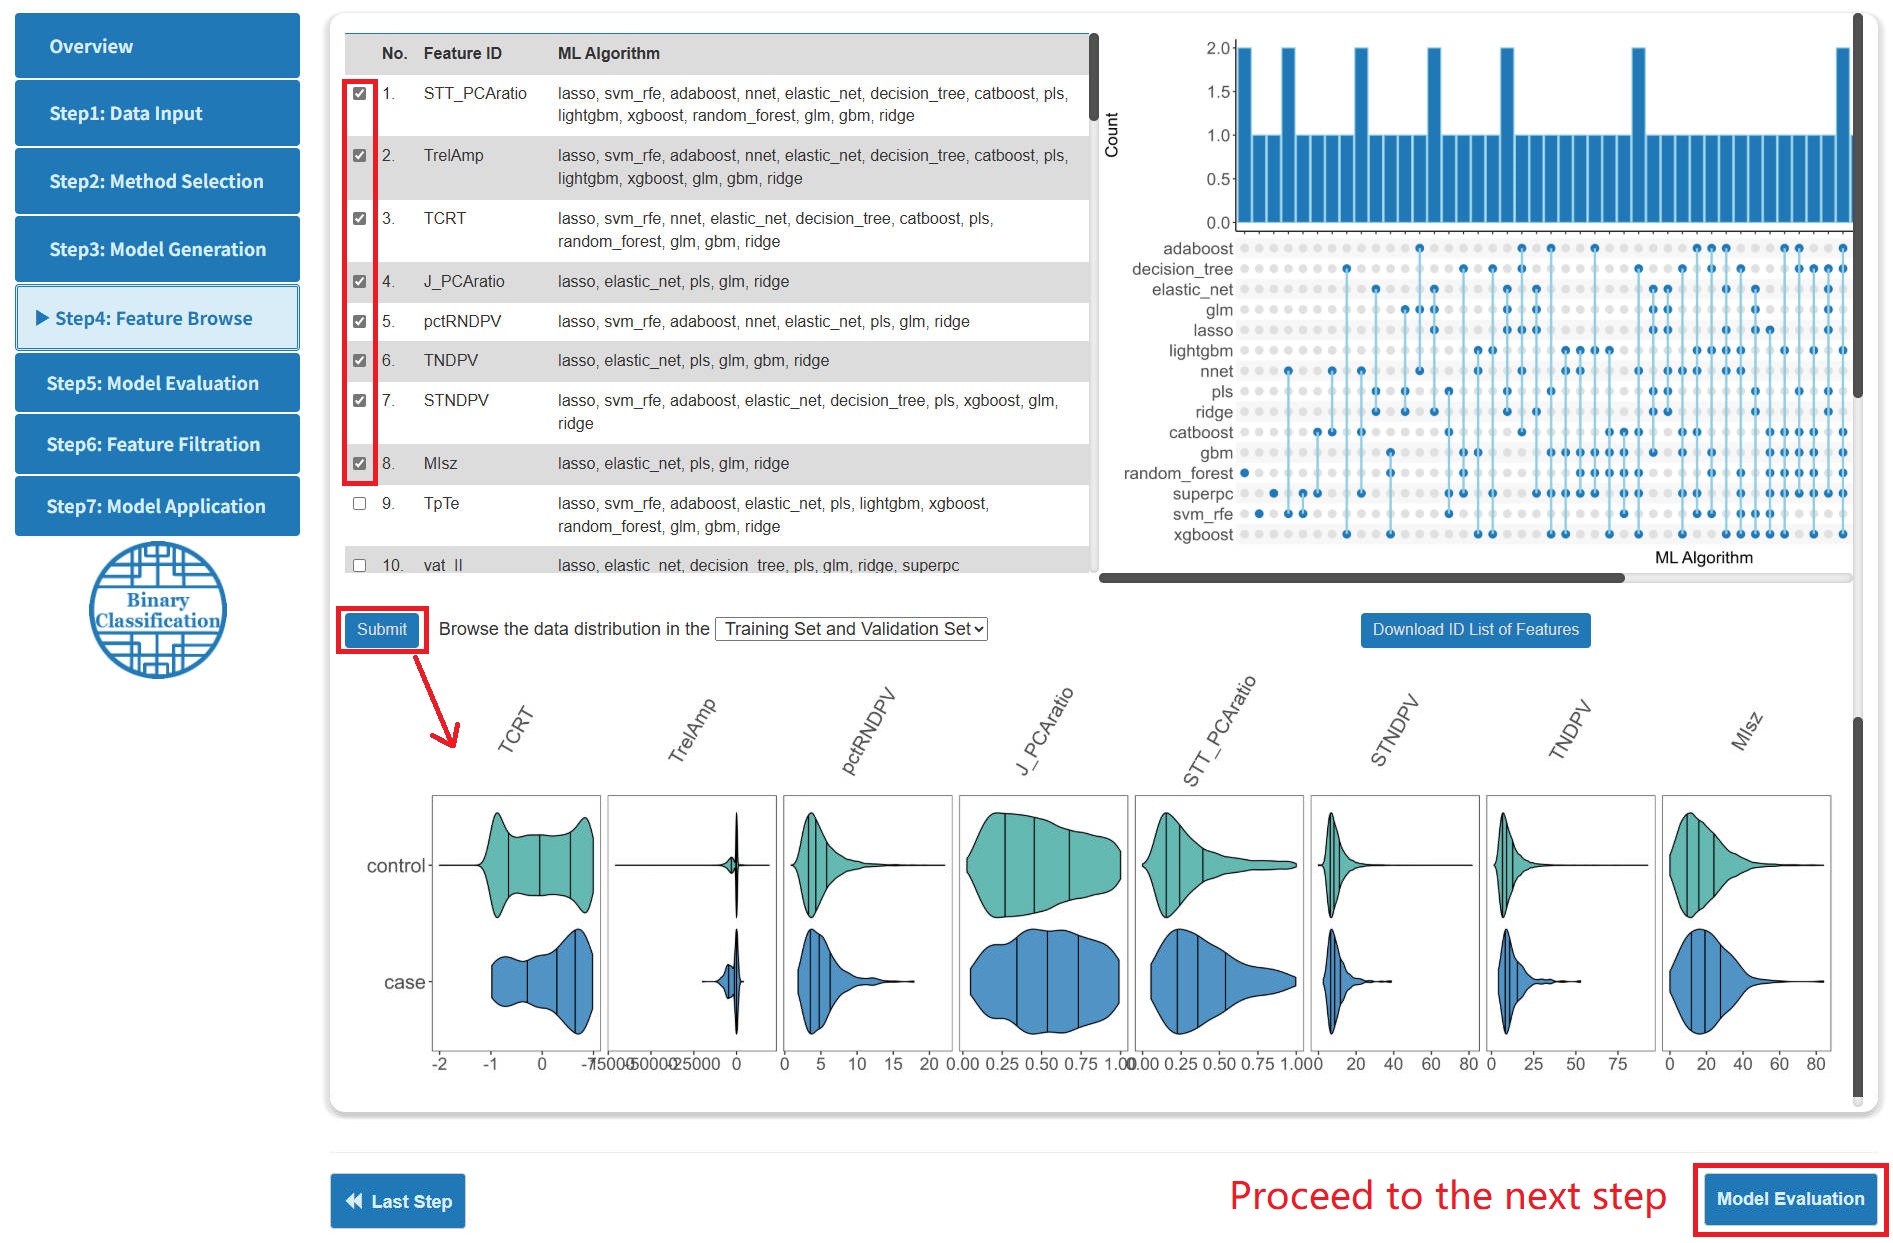
Step 4: Feature Browse
- On the "Feature Browse" page, users can browse the intersection and union of top features of models through a Upset graph, and users can select the features of interest to browse their distribution in the dataset.
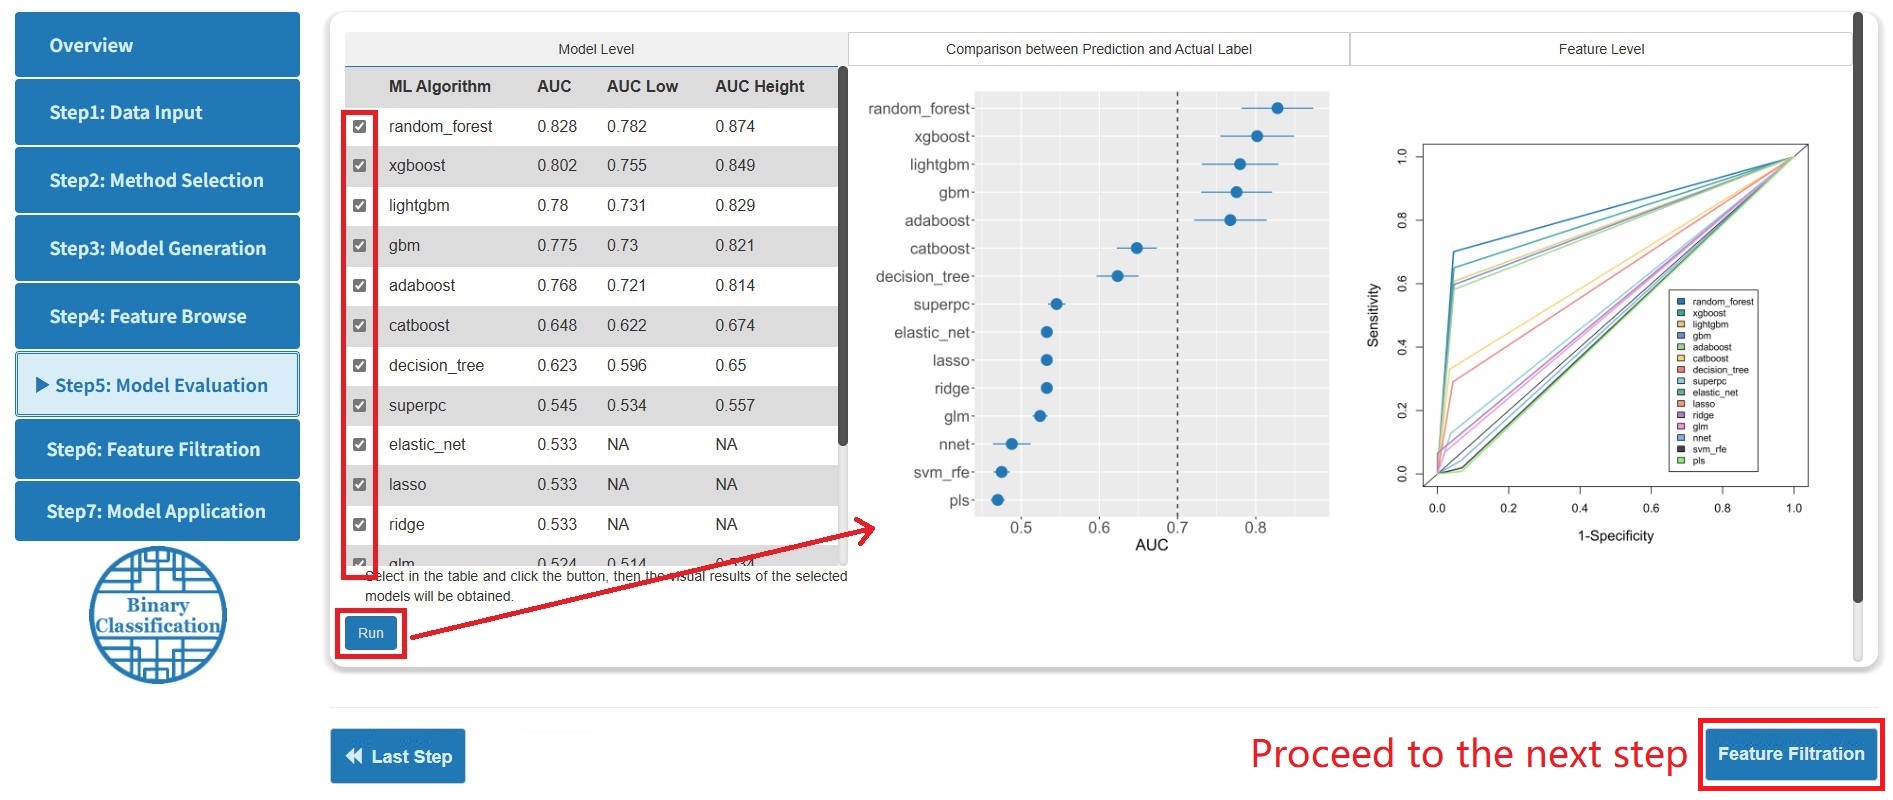
Step 5: Model Evaluation
- For binary multiple classification, MLome calculates the AUC value by ROC as the main evaluation criteria. For survival analysis, MLome calculates the c-index by fitting cox regression as the main evaluation criteria.
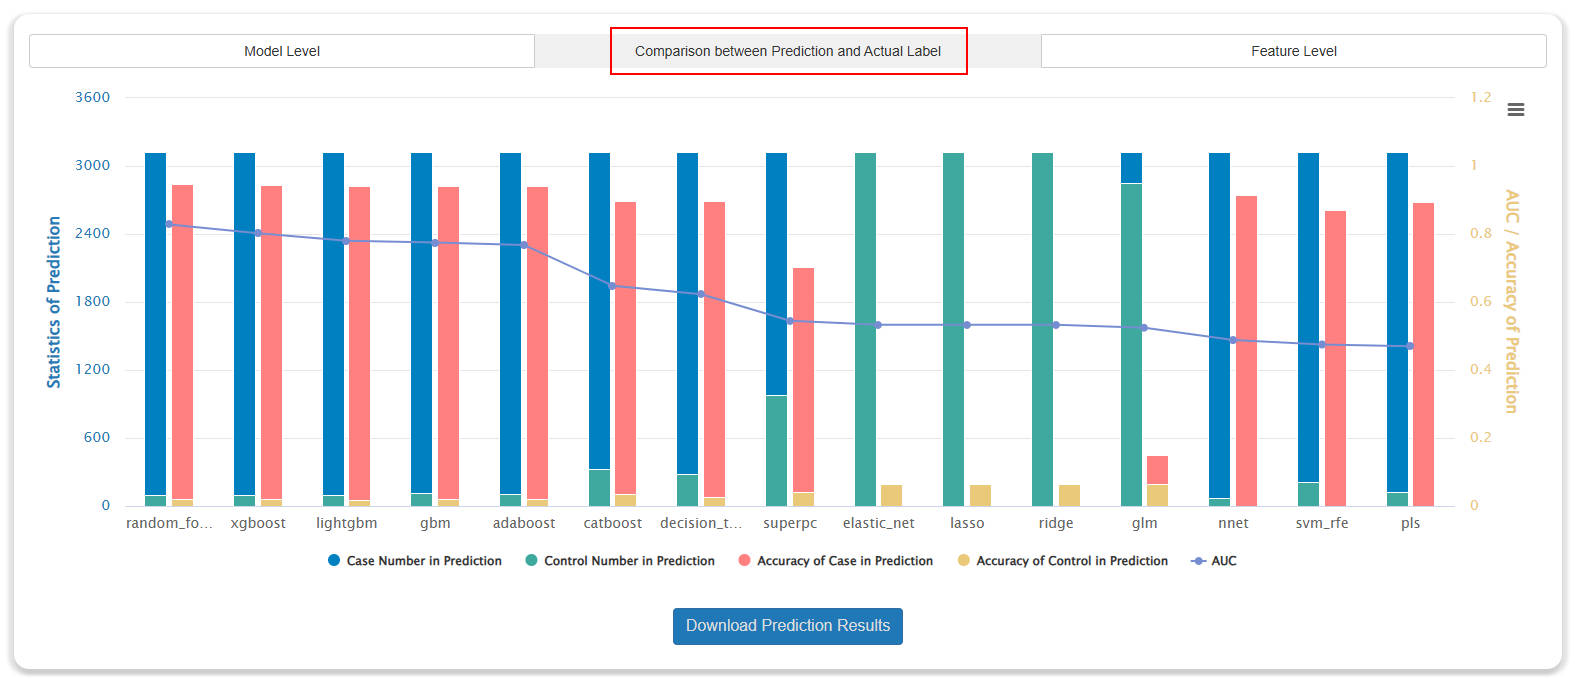
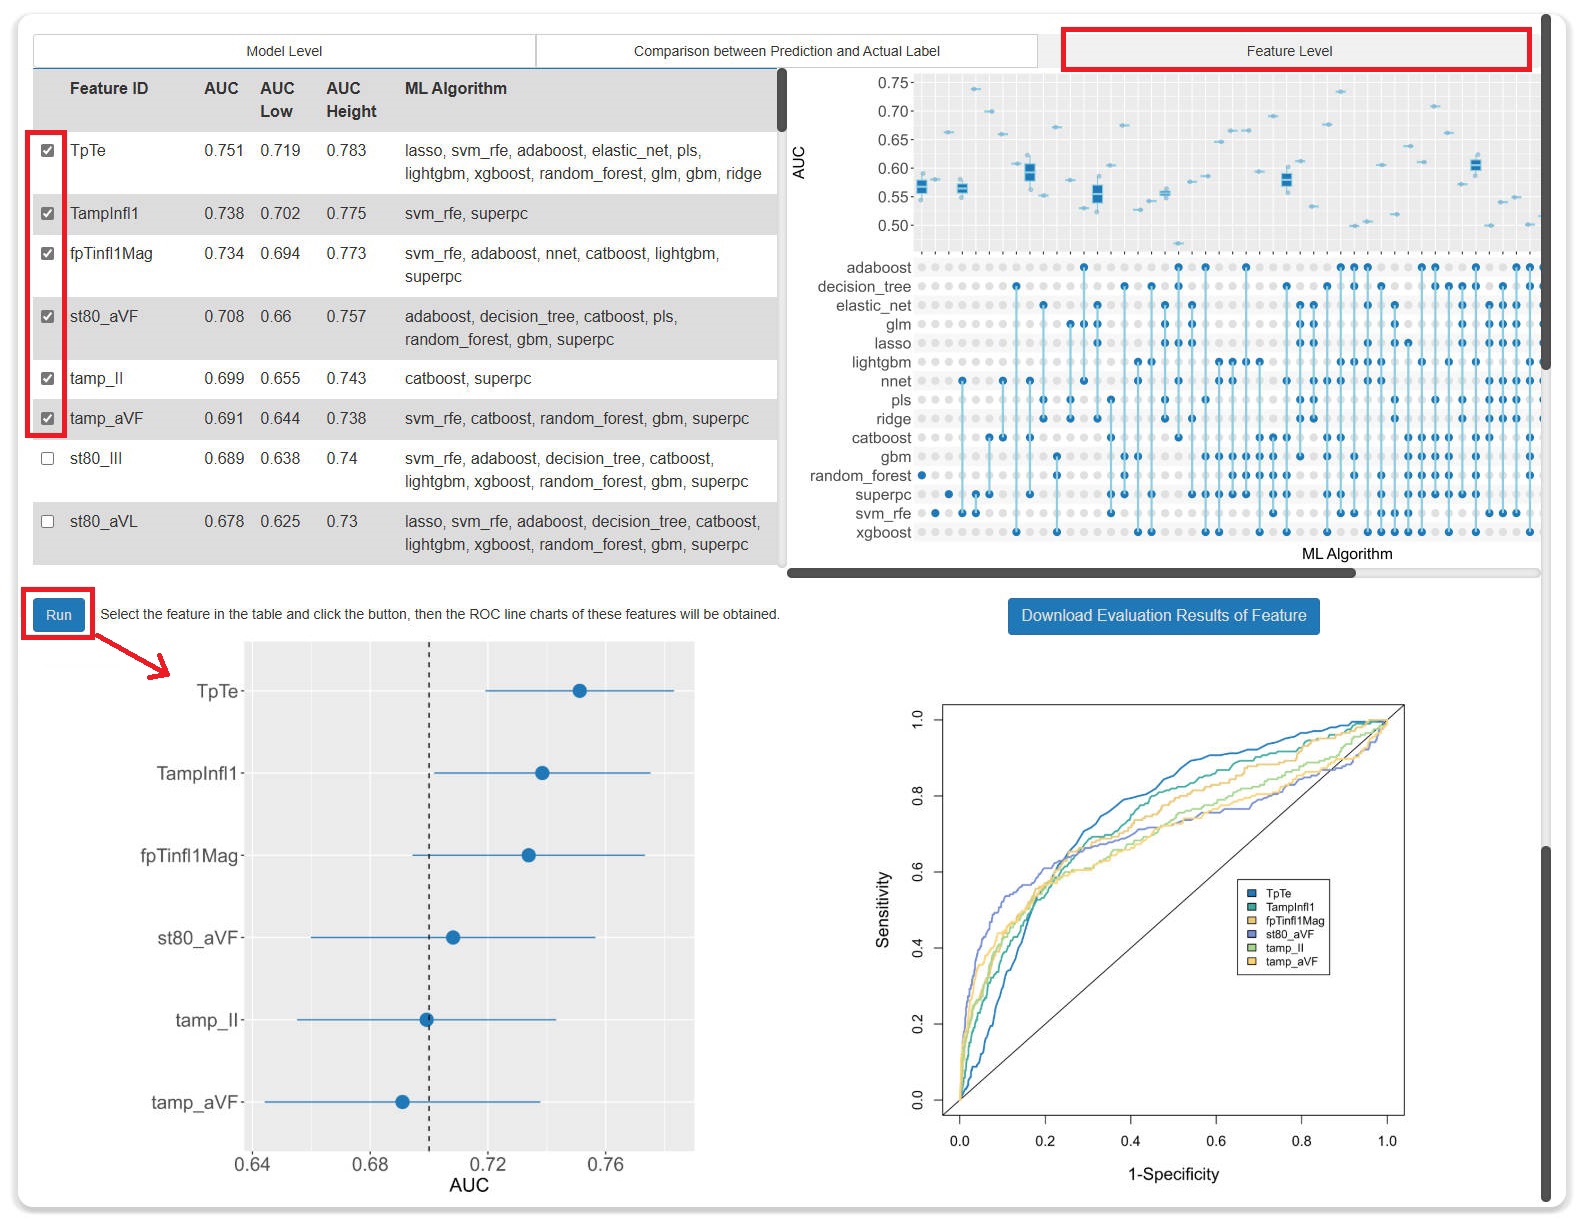
- The evaluation results consist of three parts: (1) Model-level evaluation. (2) Comparison between prediction and actual label. (3) Feature-level evaluation.
- At the model and feature levels, users can specify models or features for visualization.
- The visualization ways of binary classification, multiple classification and survival analysis at this stage are different. Here, only binary classification analysis is presented.
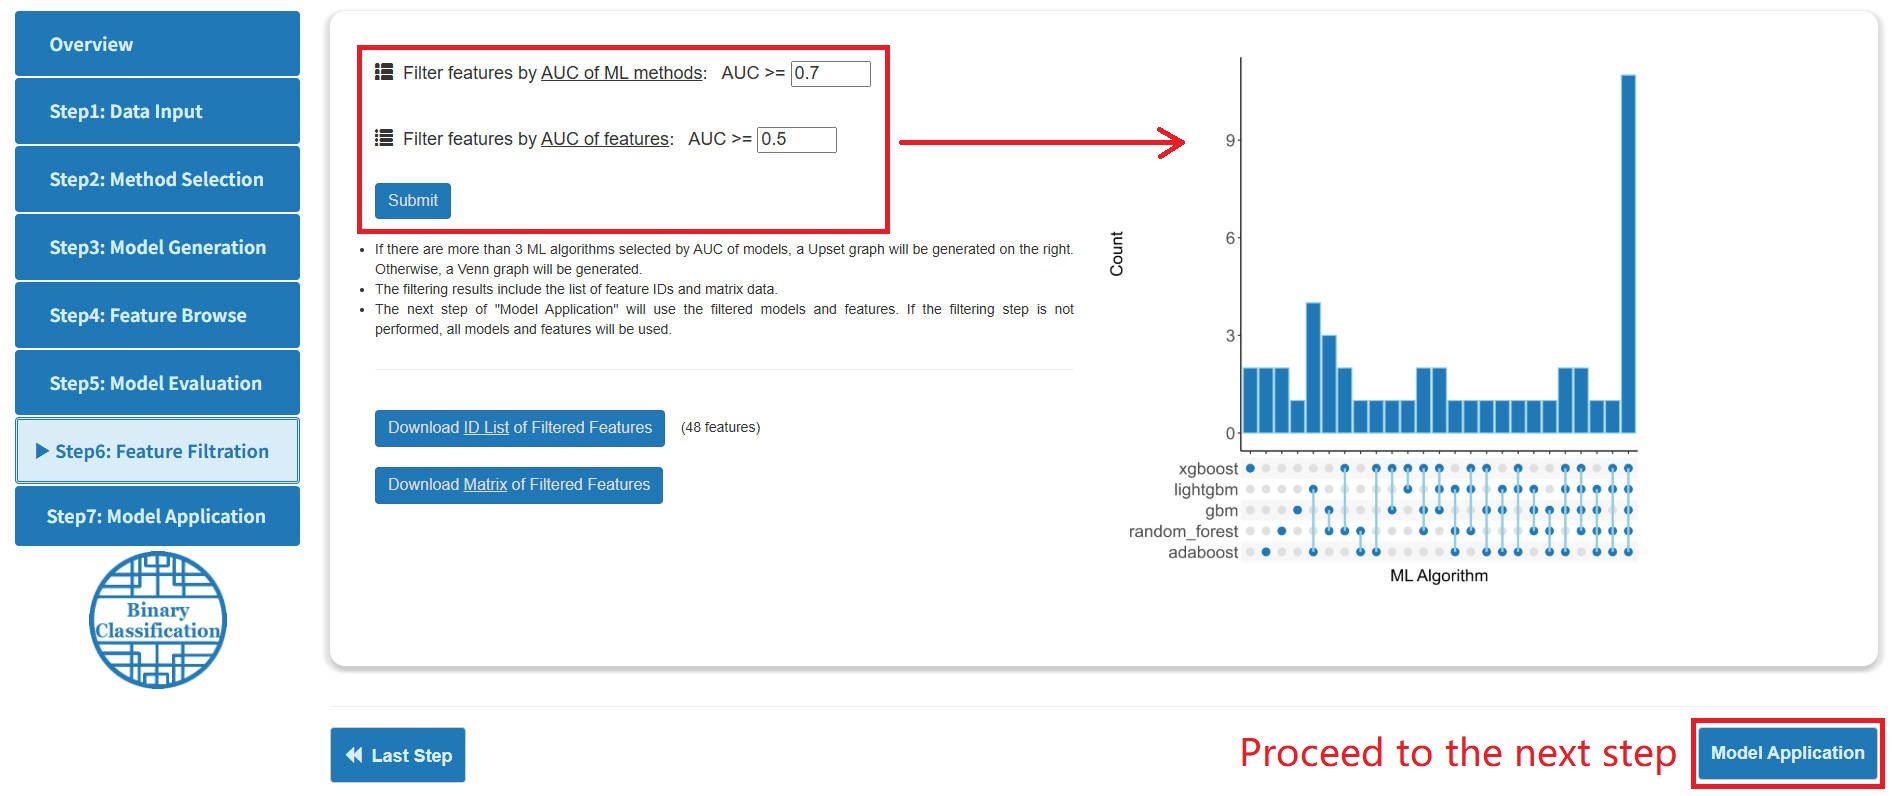
Step 6: Feature Filtration
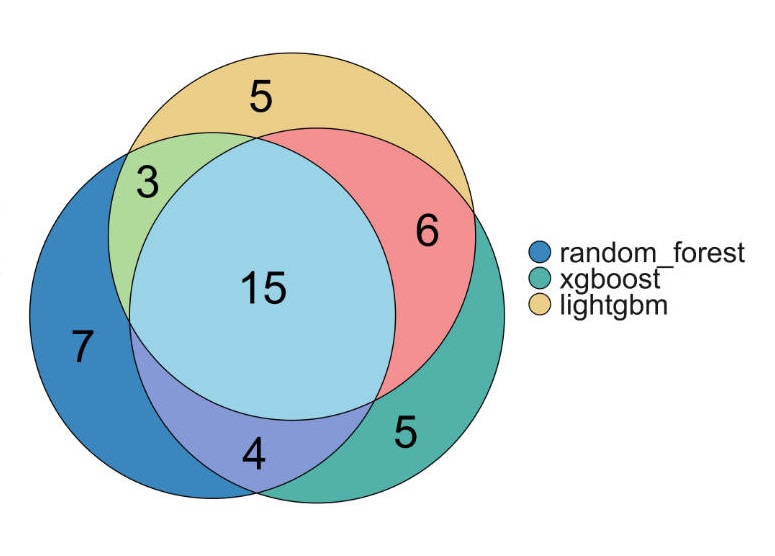
- On the "Feature Filtration" page, users can filter features by AUC / C-index. Based on the number of filtered models, MLome provides Upset and Venn diagrams to visualize the filtering results.
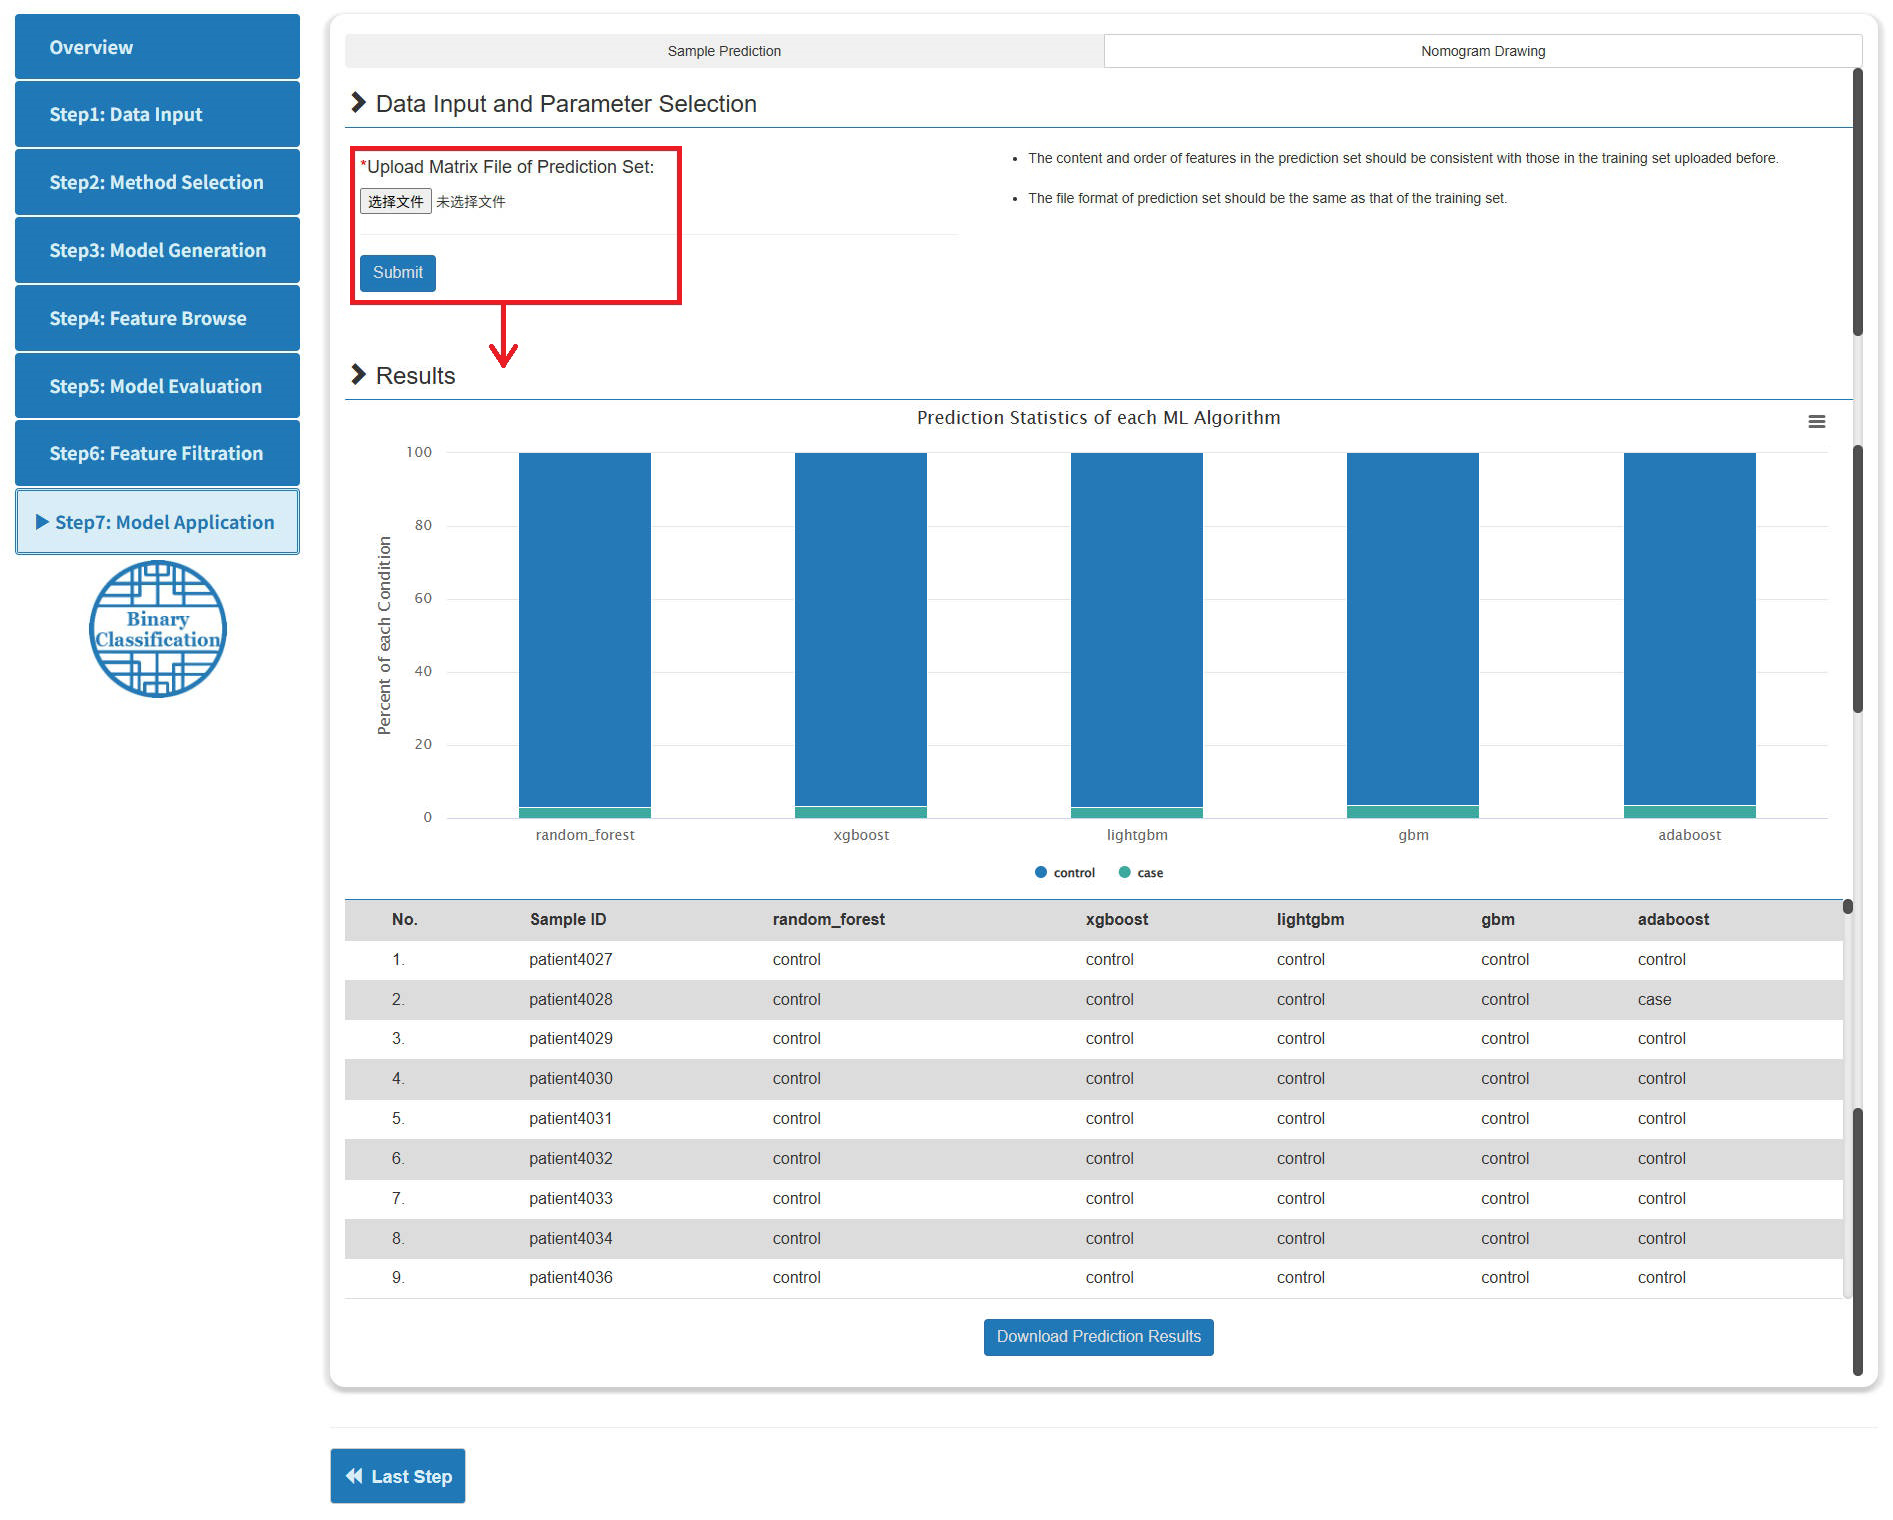
Step 7: Model Application
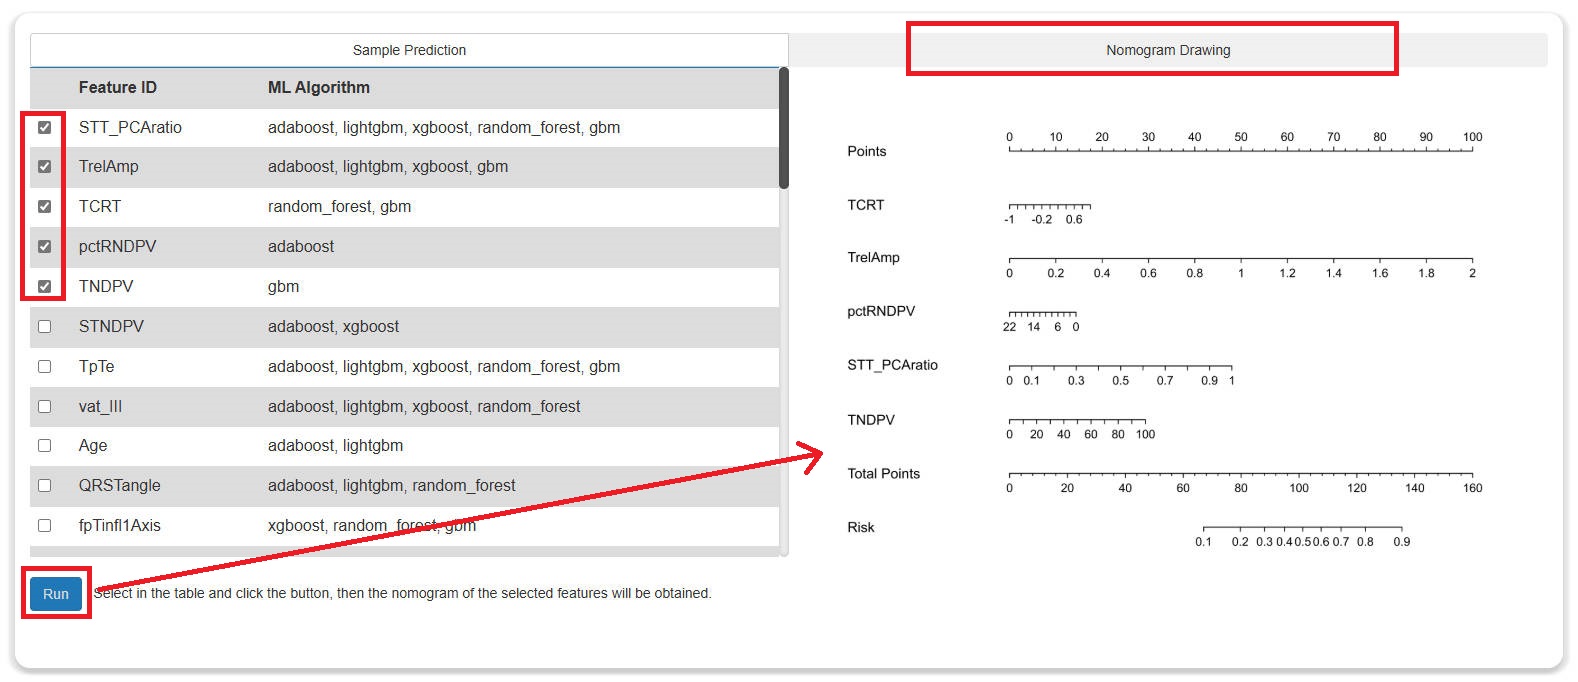
- The model application consists of two parts: sample prediction and nomogram drawing.
- For the former, users can upload the matrix file to be predicted, and the page will return the prediction results of the model screened out in the previous step.
- For the latter, users can select from the features filtered out in the previous step and draw a nomogram based on these features.